Area Reports Berawa 3BR
Berawa rental performance report

How much does a 3 bed villa in Berawa earn?

On average, a 3-bedroom villa in Berawa generates $37,596 annually at a 46.4% occupancy rate, with an ADR of $222.
But averages don't tell the whole story.

See exactly what top, bottom and averageperforming properties actually earn.

Market snapshot, history, comparable properties, current listing supply, and advanced ROI simulations

Built from tracked Airbnb performance data, ArthaBase proprietary dataset and indicators

Full interactive report

Rp 495,000

10 minutes delivery

Occupancy rates, ADR, and revenue benchmarks

24 months of seasonal revenue data

Comparable property tables with performance over time

Current listing supply and supply-for-sale movement

Advanced, customizable ROI simulation

through Apr 2026

Berawa 3-Bedroom Supply & Occupancy

Active Listings Occupancy %
Unlock full data: Purchase ArthaBase interactive report to get the complete 24-month market cycle, seasonal demand trends and comparable property data.

$37.6k

Avg Annual Revenue

46.4%

Avg Occupancy

$222

Avg Daily Rate

Investor question

How much income can you actually generate with a 3-bedroom villa in Berawa?

The answer depends on whether you are building to the market's current demands. This report skips the fluff and gives you the hard numbers to answer:

• Is Berawa currently oversupplied with 3-bedroom villas?
• What is the realistic net yield after management and operational costs?
• Why are top-tier properties outperforming the $37.6k average, and how can you replicate it?

ADR distribution in Berawa

ADR Range Over Time

What is in the report

The most complete Bali market research tool

Each module of our report unlocks a different analytical lens on the Berawa 3-bedroom villa market: top-level market health, granular comparable properties with AirBnb listing links and stress-tested investor economics.

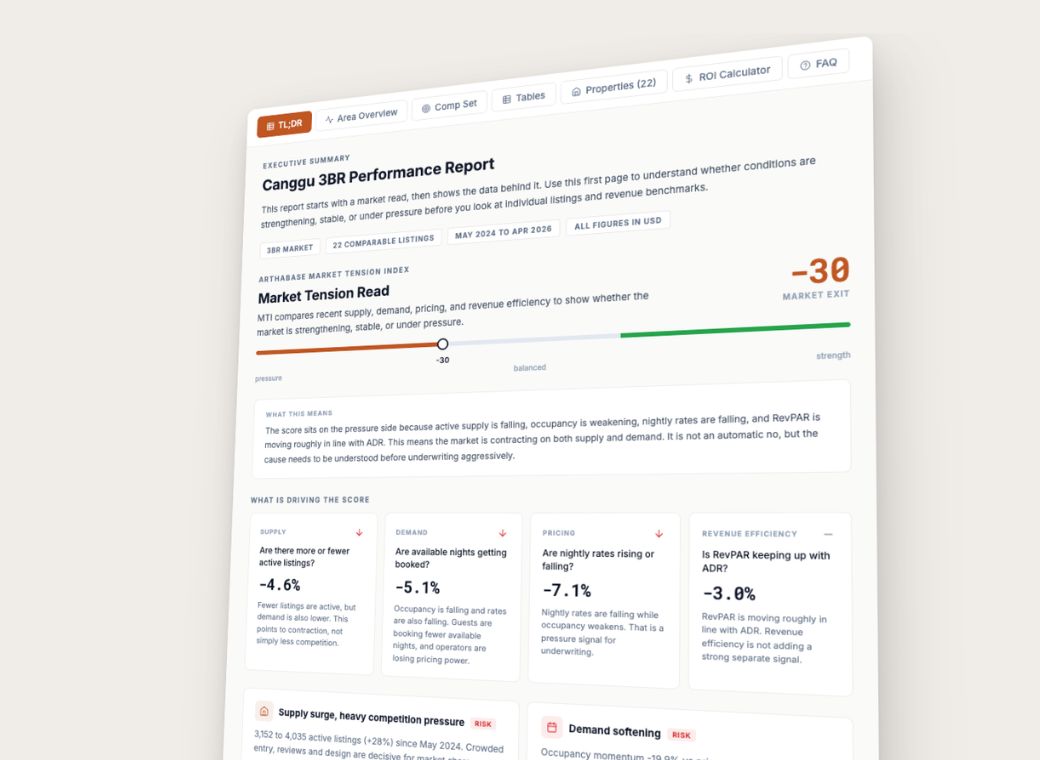
  • Not a static PDF Instead, your report is delivered as a private, interactive web page that only you can access.
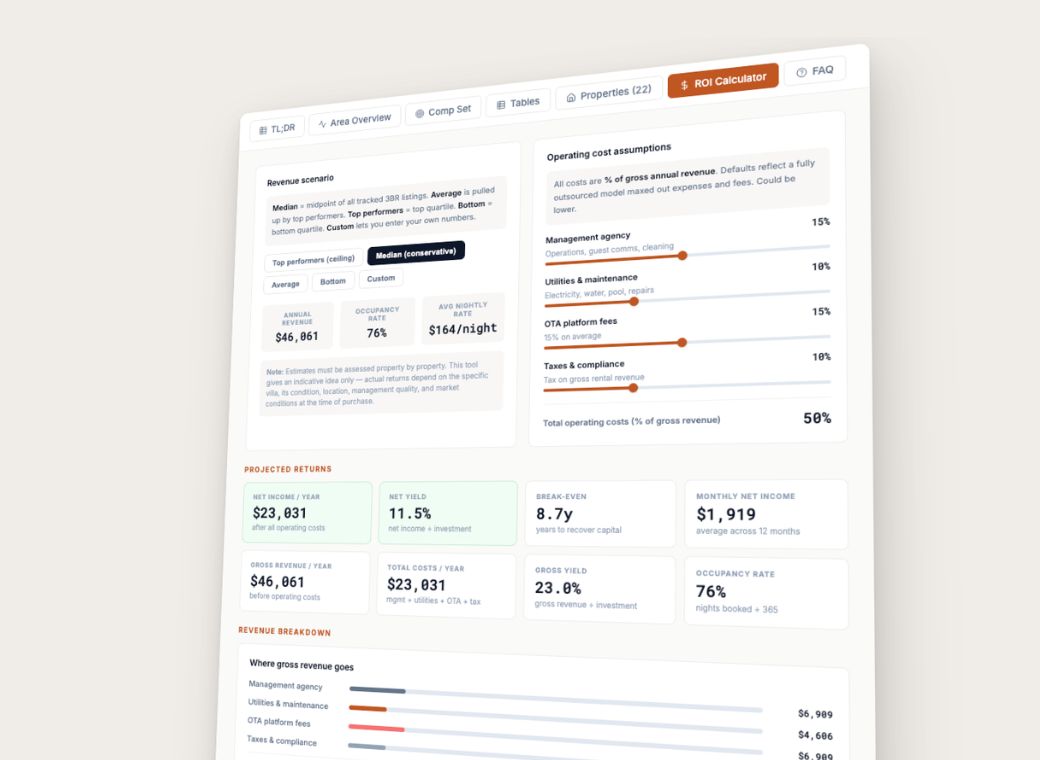
  • ROI Calculator Directly modify ROI calculator inputs to model a specific investment scenario.
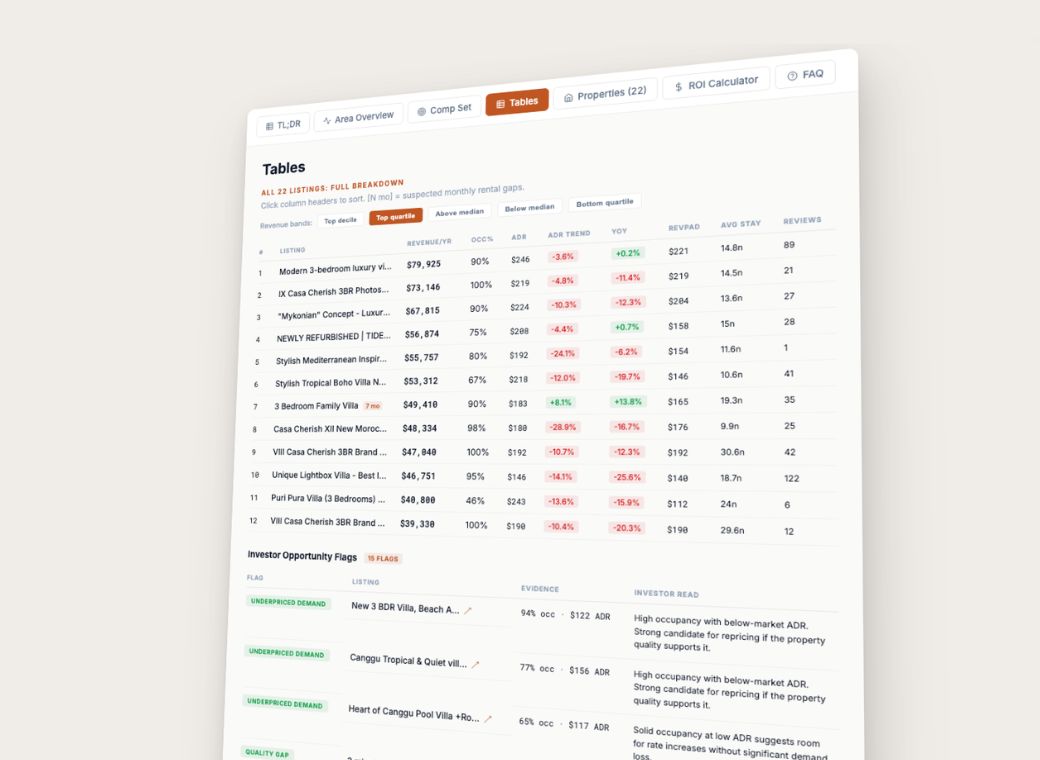
  • Sortable Tables Comparable property tables by any metric to focus on what matters to your research.
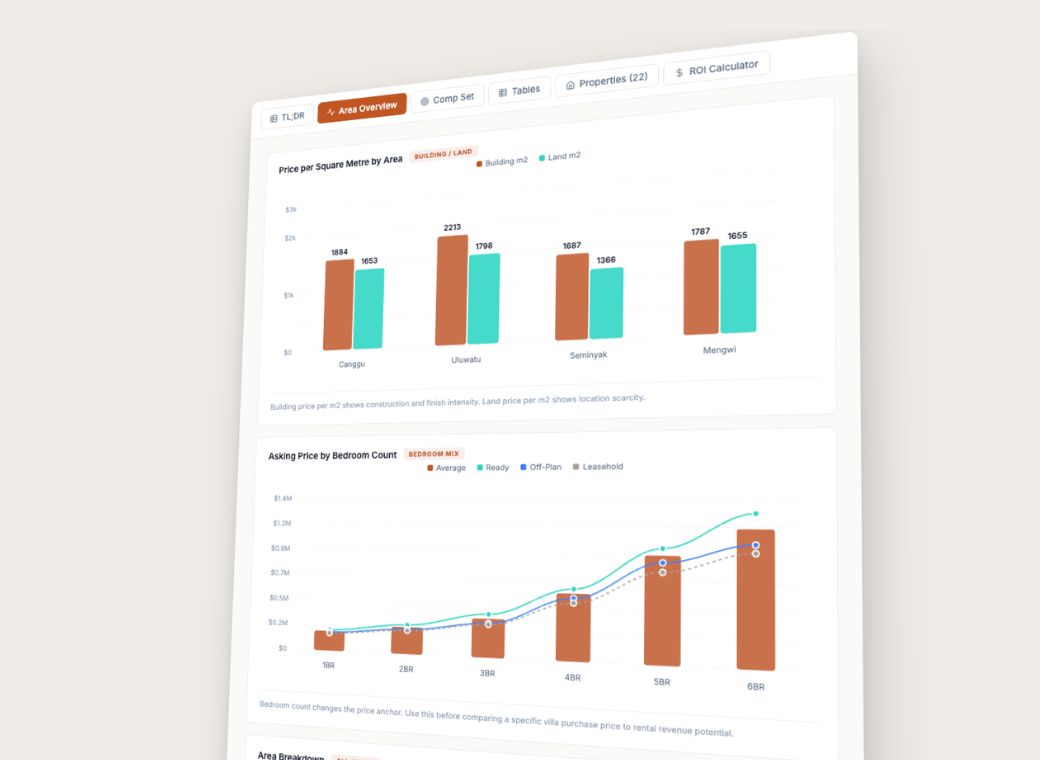
  • Interactive Charts Engage with market charts to explore trends and patterns in depth.
  • 100% unbiased ArthaBase only interest is to provide you with an objective analysis of the market and empower you to make smarter decisions and assist you while researching Bali investment potential.
Interactive report demo

Get the market snapshot from a single screen. We synthesize rental demand, pricing pressure, and revenue efficiency into a clear, easy to understand dashboard.

  • Market Tension Index Instantly see if supply, demand, and pricing are strengthening or under pressure.
  • Revenue & Occupancy Benchmarks Clear baseline averages and all-tier performance targets.
  • Booking Patterns Learn and Understand about average lead times, stay lengths, and peak vs. trough seasonal occupancy.
Mock preview of the Berawa report overview dashboard

Access granular data tables and charts covering direct competitors in the exact same neighborhood.

  • Comparable Property Tables Review the exact listings driving the market, including their specific revenue, ADR, occupancy and platform links.
  • Investor Opportunity Flags Our algorythm automatically identify listings with underpriced demand, revenue leakage, or ADR pressure.
  • Pricing Power Analytics See the exact pricing spread between premium and discount properties to benchmark your design and market.
  • Yield Momentum Track RevPAR trends to see if actual yield is keeping up with headline revenue.
Comparable set and tables preview

We track active villa sale listings to translate the real estate market into a clear and actionable context.

  • Sortable table Use filters to find properties statistics that match your criteria and see how the market is pricing them right now.
  • Live Sale Inventory Track asking prices across ready, off-plan, leasehold, and freehold properties in every major area of Bali.
  • Price Per Square Metre Compare building across different local zones and bedroom types.
  • Delivery Status Premium Understand the pricing gap between ready stock and off-plan developments.
Supply for sale analytics preview

Run investment scenarios directly from data backed rental inputs. Stress-test your capital deployed against realistic operating costs and seasonal changes.

  • Dynamic Yield Calculation Input your purchase price and adjust management, OTA, taxes and utility costs to estimate your potential net income.
  • Seasonal Cash Flow Plan for uneven income with monthly net revenue projections based on actual market seasonality.
  • Stress Testing Automatically simulate optimistic and pessimistic scenarios with ±10% rate and occupancy shocks.
  • Break-Even Tracking Estimate the number of years to recover your capital based on your selected revenue tier.
Advanced ROI simulation preview

FAQ

Questions we get about our Bali rental report.

How is the report delivered?

You will receive an email with a secure link to your report in 10 minutes after payment. This brief processing time allows our system to gather the latest available market data, clean and sort it, run it through our algorithms, and package your custom dashboard. Instead of a static PDF, your report is delivered as a private, interactive web page where you can directly adjust ROI calculator inputs, sort comparable property tables, and engage with the market charts.

Why is this a one-time purchase instead of a subscription?

Most investors don't need an expensive, ongoing data subscription, they need a clear answer for a specific asset class right now.
By offering this as a single, focused report, we cut through the noise of massive databases and reduce the cognitive load of your research. You get a complete, up-to-date investment analysis tool that allows you to evaluate the market, test ROI scenarios, and make your decision at your own pace, without the pressure of recurring monthly fees.

Where does the data come from?

All our data including revenue, occupancy, and nightly rates comes from active comparable properties inside the target location sourced via multiple professional STR data providers.

How accurate is the revenue data?

Estimates are based on observed booking activity and pricing data. They are directionally accurate for benchmarking, not a guarantee.

Who is this service for?

Buyers, researchers villa owners, agents, operators, and investors who want to cut to through the noise of Bali real estate and use a research tool that provides actionable and in depth data without relying only on opinions.

Do I need to be actively buying to use this?

Not at all. While great for vetting a specific villa location, many of our clients use our Bali market reports for early market research to evaluate empty land plots for development purposes or see how different neighborhoods are performing.

Is this a monthly subscription?

No, it is a simple flat fee of Rp. 499,000 or approximately $29.90 USD per report and you can purchase as many as you need. There are no recurring charges or hidden subscription fees. We can provide discounts for bulk orders above 10 items.

Is this investment advice?

No. Arthabase provides market data for informational purposes only. The Bali real estate market isn't data-scarce; it is data-rich but heavily fragmented and organizationally poor. Our goal is to structure that noise into clear, reliable analytical tools. All purchasing, investment, and financial decisions if any remain entirely your own. We simply show you what the market has done and what it is currently doing, not what it will do.

What if I want data for a specific property or plot?

This Bali rental report covers a pre set area. If you have a specific location and bedroom configuration in mind, the Location Report generates a hyper-local analysis for any coordinate in major neighborhoods in Bali.

Berawa market report

Know the Canggu rental market before you invest.

One interactive report. Rental history, sale supply analytics, comparable properties, and ROI simulation. Delivered in about 10 minutes.

Rp 495,000 - approx. USD 29 - not investment advice.